We have learned how to use Trends for Websites to measure core site metrics and identify strengths and weakness of our competitors.
We built on that by learning how the Google Ad Planner can help us identify demographic and psychographic attributes of the Visitors to our website, as well as our competitors. Not willing to stop there we also identified specifically how to identify Publishers where our target audiences exist, to aid in our intelligent acquisition efforts.
In the final post in this series we cover Google Insights from Search and go back to good old keywords and mining search behavior by our customers to find actionable insights.
Given the dominance of Search as a acquisition channel, you are going to have fun here.
Do the obvious thing first: Understand “head” keyword trends.
Type in a keyword and check out the trends over time, a quick peek into popularity of the terms you are interested in. . . .
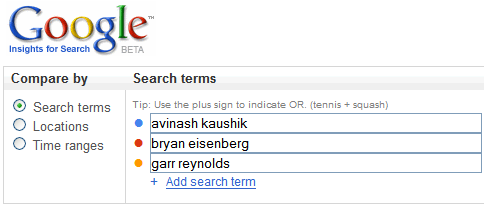
Step One: Type keywords. [I am going to compare volumes for my friend Bryan Eisenberg - Always Be Testing -, Garr Reynolds - Presentation Zen - and myself to see if I can learn anything.]
Step Two: View Data.
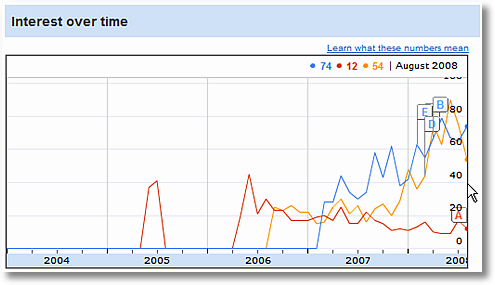
Some quick thoughts.
Bryan’s search traffic has stayed pretty consistent over time, steady over the years even as the “noise” in his unique space, persuasion architecture, has gone up quite a bit. There is a slight lower slope in the last 12 months but overall Bryan has great strength.
Garr shows up on the scene in late 2006 and you can see him stay steady and then in the latter part of last year he announces his book and you can see his plans for world domination take off like a rocket, over Q4 and he is not looking back (except in the last month).
[What do the numbers mean: The numbers on the graph reflect how many searches have been done for a particular term, relative to the total number of searches done on Google over time. More here.]
Remember always look at your data in context, hence the slope of a individual line is important but it is in context to the other lines that it gets to be more fun.
What can I do with this?
Run the graph above, atleast for all your head search terms (top 20 terms that bring most of the traffic) and see if your indexed performance (against competiton) is good or bad.
Notice those three numbers on the graph above (74, 12, 54)? You can even report monthly performance in your Management Dashboards.
You can also use these trends to validate your business strategy, unaided (or aided) brand recall, customer intent. (Or feed your paranoia: Do you matter!)
People how know me know that I love my ThinkPad (greatest laptops in the world!). You also know it used to be owned by IBM and is now Lenovo.
So I wonder how the ThinkPad brand is holding up over time vs the Lenovo brand. . . .

Good news on the Lenovo front. From no where the brand has continued to grow strong, as reflected by customer searches, and on a great slope.
Potentially not so great news on the ThinkPad front (me so sad). The brand has continued to erode steadily over time.
This should potentially be worrying because during the same time the business brands of HP and Dell laptops tend to hold steady in terms of search volume (though Dell’s seem to on a slightly over time).
Remember all this data can do is raise questions. It could be that Lenovo is being emphasized over Thinkpad, it could be that the competiton has just stayed steady on message with their brands, it could be a reflection of Lenovo’s search strategy, it could be that Lenovo believes that its core direct business strategy is so strong that the web one is not quite as important.
So what’s wrong? That’s for David to answer (in private I am sure :).
You can also use this kind of data (from Google or another source) to measure what kind of brand equity you have built over time for your core business brands.
Here’s a example: I was embarrassed that I did not know Lenovo did desktops, I recently ran into the ThinkCentre PC’s (”The ultimate business desktop”) on their website.
So I wanted to know if I was the only person in the world who did not know this. Here’s the data. . . .

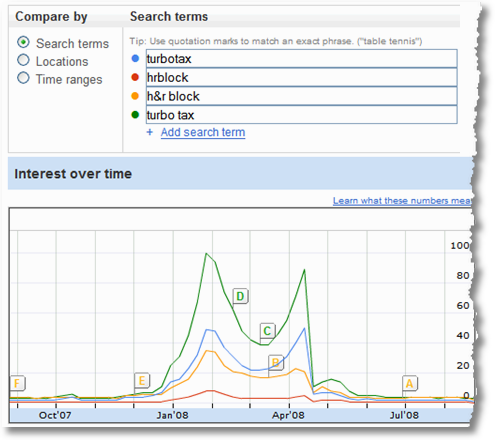
Either by design or by fate, it seems that very few people have heard of ThinkCentre PC’s – as measured by people actually typing in either ThinkCentre or Think Centre into www.google.com. That inspite of the fact, you’ll note the orange alphabet markers above, Lenovo has been pumping out press releases and news about the product.
That’s what you can do: interesting analysis about your core head terms. Analysis that helps you index your performance and raise troubling questions.
You can also get a bonus based on this data, for example Seth (who runs search strategy for the green line) probably included this in his annual performance review. . . .
: )
Google Insights for Search offers a large free source for all this rich search data, but even if you use paid solutions from Compete or HitWise you should be thinking in terms of similar analyses.
Kick it up a notch: Exploit geographic customer demand trends.
Comparing trends over the last four years is just one part of what you can do with Insights for Search. The other large component is your ability to understand them from a worldwide perspective and along geographic segments.
Continuing with the Lenovo theme, let’s try to understand opportunities for the X300 (which I really want!).
I start by trying to understand customer search behavior across different countries for the term lightweight laptop (the blue line is for “ultraportable laptop”, not quite as popular). . . .
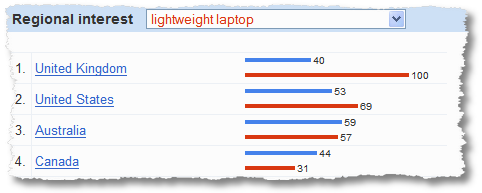
Amazingly the US comes in a bit behind the UK in terms of the search index, an obvious market to exploit. But what about rest of the world?
Here you go. . . .

Sweet. Three countries stand head and shoulders above the rest, as is obvious. It is surprising to me that Japan is hot much more obvious given their obvious propensity for small stuff.
Also notice Philippines and Malaysia show up nicely.
If I were running Lenovo’s search campaigns here is good data for me to profit from: The demand is there, are we showing up in Organic and Paid Search results for these terms?
But it gets better.
You can actually drill down to individual country level and then state level to further understand search behavior.
For that I tried something different.
While the Macbook Air is not a direct competitor to X300 (you see there are Mac people and then there are PC people :) it is possible for us consider understanding its popularity and try to be aggressive and provide the X300 as an option to those folks.
[It is to be noted, perhaps unsurprisingly, that way more people look for the Macbook Air than the X300.]
Here’s the geographic search volume index map for the X300. . . .
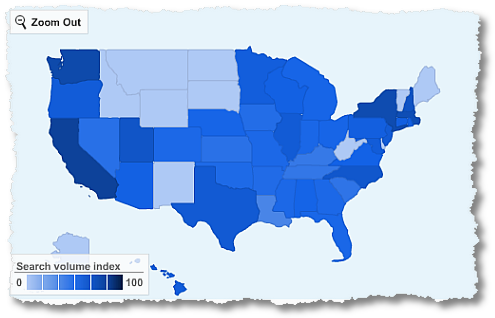
Significant search volume (indexed) on the coasts, Texas and NYC are strong (and I wonder why North Carolina is strong :)).
So how does that compare to the demand for light weight computing as represented by the Macbook Air?
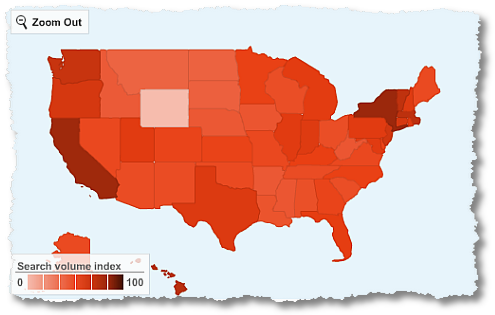
You see strengths in the same states as the X300, but there is pretty nice demand across the country, all states (except Wyoming, what’s up with people in Wyoming?).
So clearly there is demand, but people are not looking for us. Clearly great opportunities for a aggressive Marketer at Lenovo to exploit this difference and build demand for the X300.
She/He can obviously use Organic or Paid Search on Google. But in those empty states up top for the X300 the Marketer could just as well consider doing TV or Radio or Print or Newspaper or even buy geo targeted banner ads on www.yahoo.com to get the brand out there and get in the face of those people who are looking for light weight computers.
Bottomline: Insights for search exposes customer demand across geography, you can use that data to optimize your online and offline campaigns to benefit from that demand.
It bears saying that this is not some phone survey data by bugging people at dinner time, this is not panel data extrapolated to infinity, these are not online surveys. These are actual queries typed by actual people who are actually looking for you (or your competitors). You can see how it is vastly superior.
Go for gold: Ecosystem: Identify “related terms”, “rising terms”.
As all good SEO girls and boys know it is not all just about the terms you are interested in, it is all also about the ecosystem related terms if you really want to win the search game big (on any search engine online).
I have stressed quite a bit on this blog about moving beyond the top 10 or top 20 (tip of the iceberg) to what’s happening in the massive long list of keywords (below the tip of the iceberg, hidden under the water). Statistical techniques like “what’s changed” are fantastic at this. I am quite pleased that Insights for Search offers a “what’s changed” view as well!
Since we were just working on understanding lightweight laptops, here is the first nice bit of insight from the tool. . . .
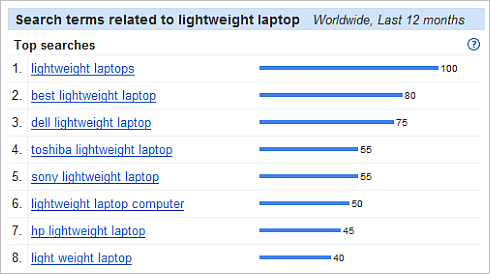
Two action items.
1) You can ensure, if you are doing SEM, that you are taking into consideration all these related terms to ensure your bidding (or even SEO) portfolio contains the right terms.
2) Every time I find competitors here, and not myself, I feel a bit sad. Clearly in this category Users are typing competitor terms and that is sad (Ok, ok I am religious. Ok, I am happy for them. There. Happy now?)
You can see how this can give you insights across other categories, and customer preferences. Remember our use of Pampers as and example last week in the Ad Planner post? So how is the picture for diapers?

Someone at P&G should start worrying that cloth diapers is so huge in this category. You can easily see how the numbers above reflect the individual success of Pampers and Huggies (the two big brands here in the US).
Related terms are good to understand. More awesomely awesome are “rising searches”, terms that are not quite yet in the top but are rapidly becoming important in this category.
Here’s the story for our lightweight laptop category. . . .
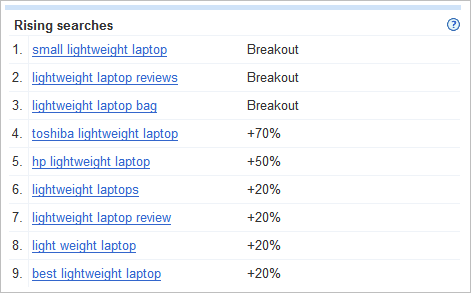
Whatever it is that Toshiba and HP are doing in terms of their online and offline campaigns (branding or otherwise) is clearly working because terms with their individual brand names are rapidly rising in customer conscious (and hence them typing into search engines). I
Beyond that at the minimum what this list offers are keyword and key phrases that you might not have considered but you should.
Rising searches to me is also a fantastic way to understand trends that will become mainstream in the future, but currently are just rising. So not only do people want lightweight laptops, they also want them to be small. As an example.
So what about our diaper category?
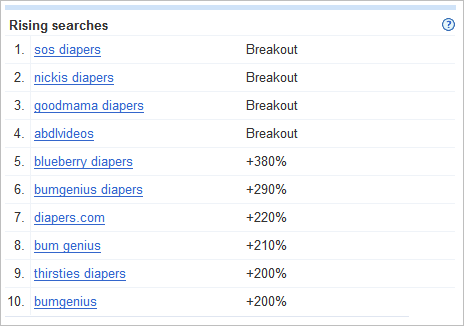
Someone at bumGenius deserves a raise, it is astonishing how much they dominate the tidal wave of rising attention at the moment. Clearly the environmental movement is catching on.
None of the main brands are present there.
Perhaps P&G should buy bumGenius to preserve future revenues. :)
I have to also admit that I had never heard of any of the diaper brands above, a reflection of how some of these trends are so hidden under the radar and then end up surprising Marketers when they hit mainstream. By then it is too late.
Bottomline: Use the data above to identify bleeding edge trends for your industry, key words, ecosystem before it is too late.
Some last goodies: Time Range Trends, Locations & Categories.
Couple more fun things you can do with Insights for Search. You can more view trends for different time periods.
I am going to check the performance of my brand over two years and if I am getting better or worse. . . .

Click Search and. . . .
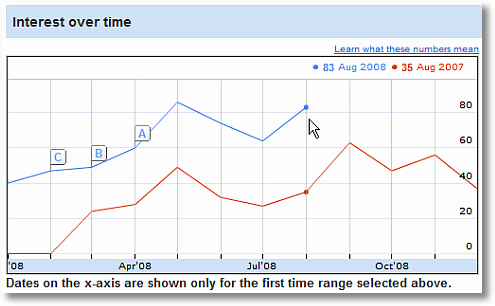
No presence in the Jan 2007 time frame (why! :)), and doing much better since then. Doing much better year over year. Happy birthday to me. :)
It is interesting to see the dips over summer. I wonder what causes that (any guesses?).
Do this graph for all your core brand terms, for your category terms, for your performance for your industry “rising terms”. You’ll have insights up the wazoo.
Another example. A real business. From my visit to P&G, year over year performance for one of their biggest worldwide brands (one of their biggest advertising spenders offline) Gillette. . . .
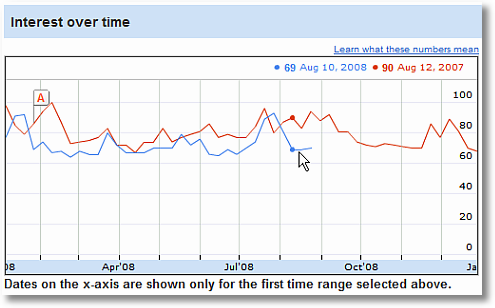
Quite sad.
So much money spent hiring Tiger Woods, Roger Federer and Thierry Henry, so many very nice tv commercials, and so many nice print ads. But online they are doing much worse year over year.
I bet for the cost of airing just five of those TV ads Gillette could easily reverse the trend above, if it really set its heart on winning online.
Switching gears.
You can also do category searches in insights for search.
So what are the terms that are top in the Auto Insurance category in the US?

And boom!

Delightful, right?
And don’t forget to look at the Rising Terms, that’s where the real meat is. Motorcycle insurance is rising, travelers and nationwide are both rising brands (good for them!).
Finally you can also do some fun stuff.
I did a search on the “hottest” (rising searches) celebrities (category: entertainment, sub category: celebrities) in New York in the last 30 days to see how much I am in sync with popular culture. . . .

Who in the world is Kim Kardashian? I feel lame, I am so out of touch.
Oh here are the ones getting hot in the last 30 days. . . .
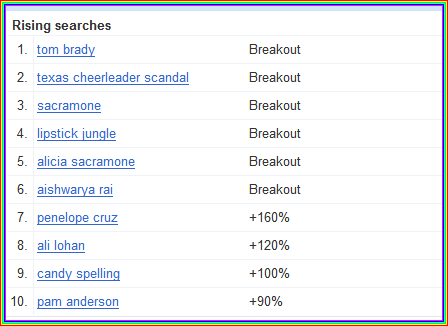
Go Tom Brady and Aishwarya Rai!! And some things are evergreen, go Ms. Anderson! : )
Do I need to explain how you can use this data for business purposes? Think hottest hotels or business schools or computer software or web hosting providers or charitable causes or . . . . well you get the idea.
Agree, pretty damn cool and actionable?
I hope that your have learned how to leverage Insights for Search for your business, but more than that I hope how you can use the techniques in any tool that provides search data (like Compete or HitWise).
Before we close, some helpful links:
- Google Insights for Search Help Center
- How does Google Insights for Search work?
- What are search term matching options?
- What do the numbers on the graph mean?
Ok your turn now.
What do you think? Was it fun? Did you learn anything new? Did the business cases I used make sense? Have you used the tool, what did you not like about it? Anything obvious that I missed about how to use it? Do you use other tools to get this type of data?
Source : www.kaushik.net
Thanks for reading, Have a nice day :)!!! Suscribe my post
Tidak ada komentar:
Posting Komentar